The activity logs give you a quick overview of what’s been happening on your WordPress site. It shows you important statistics and recent events to help you monitor your site’s activity.

Navigation Tabs
- Dashboard: Current view showing statistics and summaries
- All Logs: View all recorded activities
- Security Incidents: See only important security-related events
Time Period Filter
Choose how far back you want to see activity:
- You can change this to see different time ranges
Statistics Overview
These boxes give you quick insights:
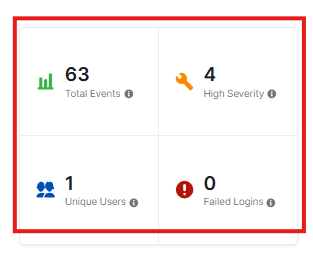
- Total Events: How many activities have occurred (63 in this example)
- High Severity: Number of important security events
- Unique Users: How many different people have been active
- Failed Logins: Any unsuccessful login attempts
Severity Distribution
This shows how serious the events were:
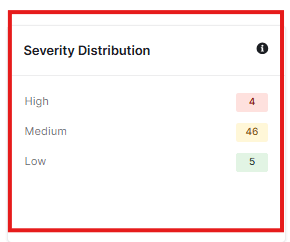
- High: Most critical events
- Medium: Moderately important events
- Low: Less critical events
Top Event Types
See what activities happen most often:
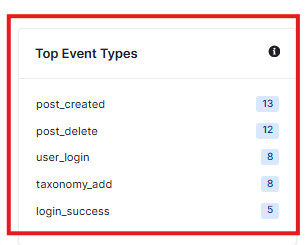
- post_created: New posts or pages added
- post_delete: Posts or pages removed
- user_login: Users logging in
- taxonomy_add: Categories or tags created
- login_success: Successful logins
Recent Critical Events
This section shows the most important recent activities:
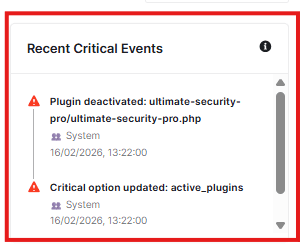
- Plugin deactivations
- Critical setting changes
- When they happened
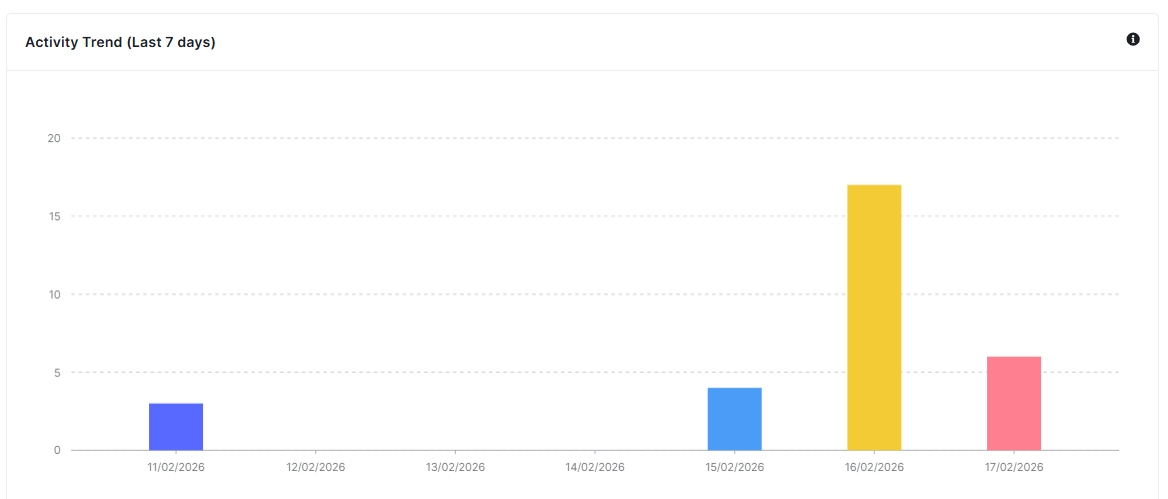
Activity Trend
This is a visual graph of security events over time, which gives you an idea of patterns and unusual activity spikes
